This happened a while ago, but I used my company's qualification support program to take and obtain the Google Data Analytics Professional Certification course.
I'll give you a rough idea of what you'll learn and how difficult the course is, along with my impressions of taking the course!
What is the Google Data Analytics Professional Certification?
This online learning program provided by Google teaches everything from data analysis fundamentals to applications.8 courses in totalYou will learn in two parts.
- How to proceed with data analysis
- How to organize analytical data
- Using spreadsheets
- Data organization using SQL
- Creating visualizations with Tableau
- Using R Markdown
It covered a pretty wide range of skills.
The recommended time is 10 hours a week for about 6 months, but I prefer to work at a slower pace.Approximately 4 monthsIf you concentrate, I think you can complete the course in a shorter period of time.
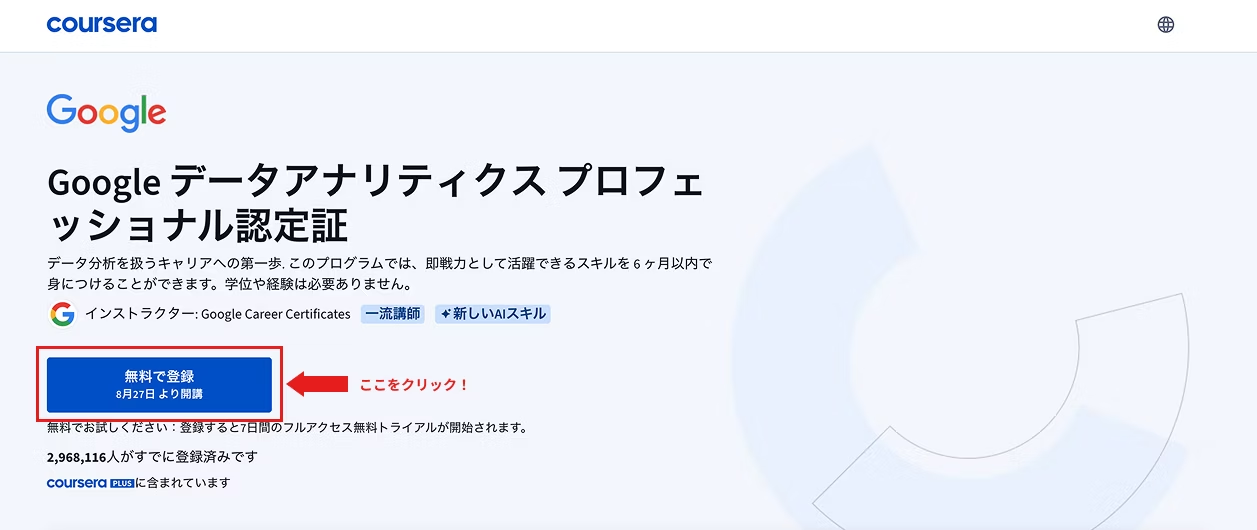
Courses are taken through a platform called Coursera, and require a monthly fee. There are occasional free course campaigns, so it's a good idea to take advantage of those.
There is a one-week trial period, so you can use that time to decide whether you can take the course properly. Please note that the subscription will be automatically renewed after the trial period ends!
You can get started right away by enrolling on Coursera's Google Data Analytics Professional Certificate page.
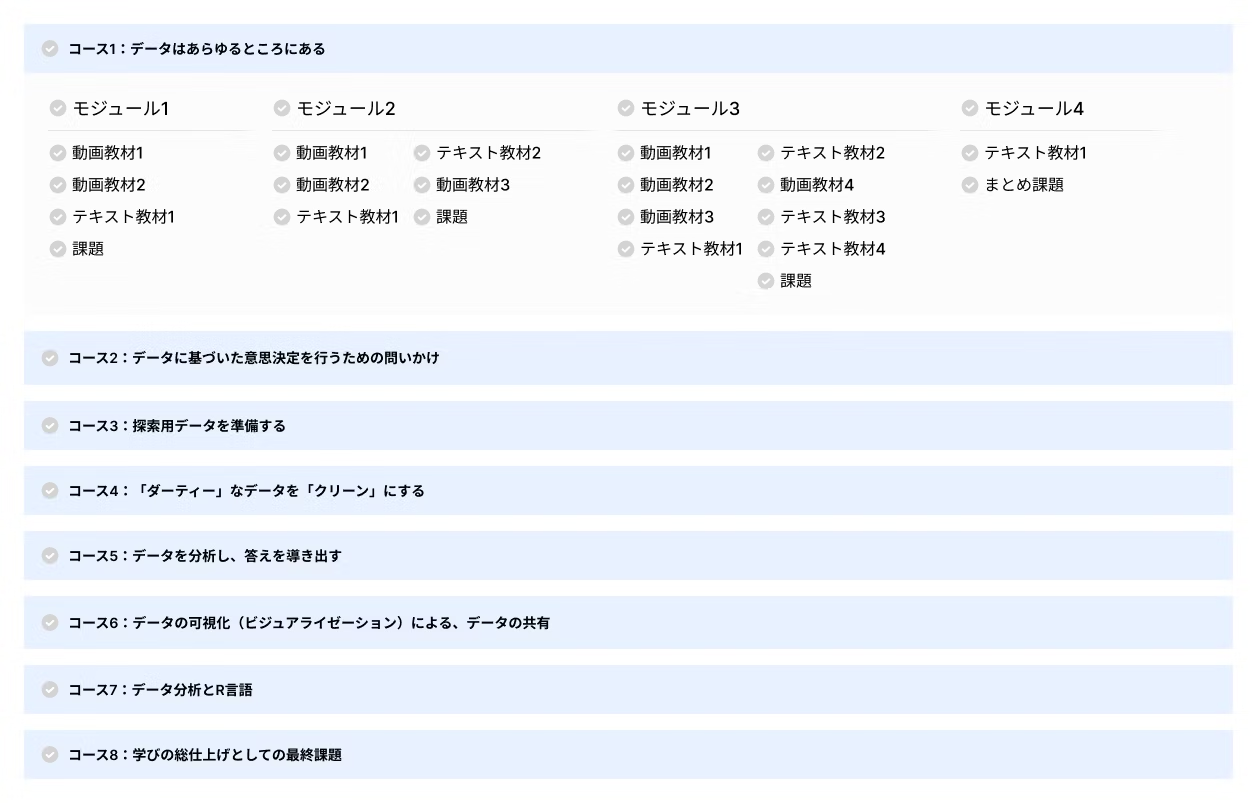
Learning flow
Each course is structured as a series of multiple modules, and you must complete all the learning materials (videos, documents, etc.) and take the tests for each module. If you complete all the course assignments, you will be issued a certificate of completion.
The documentation also includes links to related tools and external learning materials, which helps deepen understanding. However, it would take too long to go through everything in detail, so I started by taking notes of terms and links, and then looked them up later.
This way the test passes without any problems!
Since there is a huge amount of work, I was saved by the conscientious design that allows me to change the status to "completed" at any time I like.
Difficulty of taking the course
When I hear the words "SQL" and "R" I feel a little intimidated, but they provide thorough and detailed explanations from the beginning, so it wasn't that difficult.
You can pass the test if you read the study materials carefully, and the system is designed to be extremely user-friendly, allowing you to retake the test if you don't reach the passing grade.
Although there is a limit to the number of times you can take the comprehensive test per day, the limit is reset after 24 hours, so you can essentially take it as many times as you want!
Tools that you may not normally use, such as BigQuery, Tableau, and Rstudio, will also be introduced, but there is no need to worry as they will also be explained in detail from installation to usage.
Furthermore, the tools used for learning are designed to be free, so there are no additional costs beyond Coursera's monthly fee, making it easy on the wallet.
Another feature that I found difficult was the translation function.
The study materials are primarily in English. Of course, the videos, documents, and tests all have translation functions, and the accuracy is quite high, but occasionally words with similar meanings are translated into the same Japanese.
In multiple choice questions, it was not uncommon for two seemingly identical options to appear side by side, which presented a different level of difficulty.
Introduction to each course
That was a long introduction, but from here on I'd like to introduce the learning content of each course.
[Course 1: Data is Everywhere] This is the first course, and it is primarily a classroom course that teaches the basics of data analysis. You will learn the process by which data analysts conduct their analysis. What you learn here will form the foundation for your studies in Course 2 and beyond.
[Course 2: Questions for Data-Driven Decisions] This course focuses on the questions you need to ask to dig deeper into the issues you need to solve. You will learn how to conduct interviews, communicate, and share analysis results.
This is where the hands-on learning begins! You will learn common knowledge that is often used in the workplace, such as basic spreadsheet functions and types of errors.
It's a relatively easy course to progress through.
[Course 3: Preparing Data for Exploration] This is the process of preparing data for analysis. You will learn about data structure and collection methods, and understand the concept of "clean data," which is the core of Course 4. In addition to spreadsheets, you will also learn data manipulation using SQL with BigQuery. This is the first difficult part.
If you don't get a firm grasp of the basics, you will run into trouble later, so we recommend that you proceed slowly while understanding the material.
[Course 4: Making "dirty" data "clean"]
Learn how to clean your data, which is essential for improving the accuracy of your analysis.
After understanding why cleaning is necessary and what happens if dirty data is analyzed, you will experience data cleaning using spreadsheets and BigQuery.
It was quite challenging as it involved a lot of functions and queries.
[Course 5: Analyzing Data and Finding Answers]
You will put into practice the "data preparation" and "cleaning" processes you have learned so far and process the data. This is the core phase of the program, where you can narrow down the data by specific criteria, calculate averages, and use various calculations to uncover hidden facts and trends in the data.
[Course 6: Sharing data through data visualization]
You will learn how to use Tableau to visualize data and share it effectively. Even when I followed the instructions in the video, I often encountered errors and the results were not reflected, which was quite a struggle for me.
It's a tool that can be used intuitively without any specialized knowledge, but to be honest, I still don't have the confidence to use it to its full potential...
[Course 7: Data Analysis and R Language]
This is where data analysis using the R programming language finally comes into play. Since the course starts with installing R, you shouldn't have any trouble if you follow the instructional materials. However, be careful, as you move on to the analysis and visualization phases, you'll encounter unfamiliar words and concepts.
The range of visualizations you can create is wider than with Tableau, and once you get the hang of it, it becomes a lot of fun. It was also appealing that you could create reports entirely in R.
This was the course I personally enjoyed the most.
[Course 8: Final assignment to round out your learning]
This is the culmination of the program! Students will use what they have learned so far to attempt data analysis on their own. Through several case studies, students will create their own output.
The second half of the course focuses on job hunting for data analysts. You can learn by watching image scenes of interviews, but the atmosphere is different from Japanese interviews, so I think it's best to just watch it as a reference. To be honest, I just skimmed through it.
summary
This has been a long introduction, but what do you think?
I have included points that I personally would like to know before taking the course, without touching on the main content.
My honest impression after taking the course is that it is an easy qualification to obtain for those with no prior experience who are looking to get a job or change jobs in the web industry. There may not be many opportunities to use it in daily work at a production company, but when the time comes, it is definitely better to be able to analyze data than not to be able to.
Even tools that you don't normally use are carefully explained from introduction to basic usage, so even those with no experience in the web industry can learn with confidence. However, those who want to delve deeper into more applied uses may find it a little lacking. The "Google Data Analytics Professional Certification" is not very well known, but I think it has the great advantage of being able to publicly prove that you have Google-certified data analysis skills.
If you're interested, you can start with a free trial.


He joined the company as a new graduate and is currently working hard as a director! He is challenging himself every day to become a multi-talented person who can master all fields, from design to advertising management. While he strives for smart direction at work, in his private life he enjoys the reclusive life in the fortress called home. He also likes anime.
Handa
Web Director/Joined in 2022